How to Inspect and Tune PDF Layout Analysis in Analyze Mode
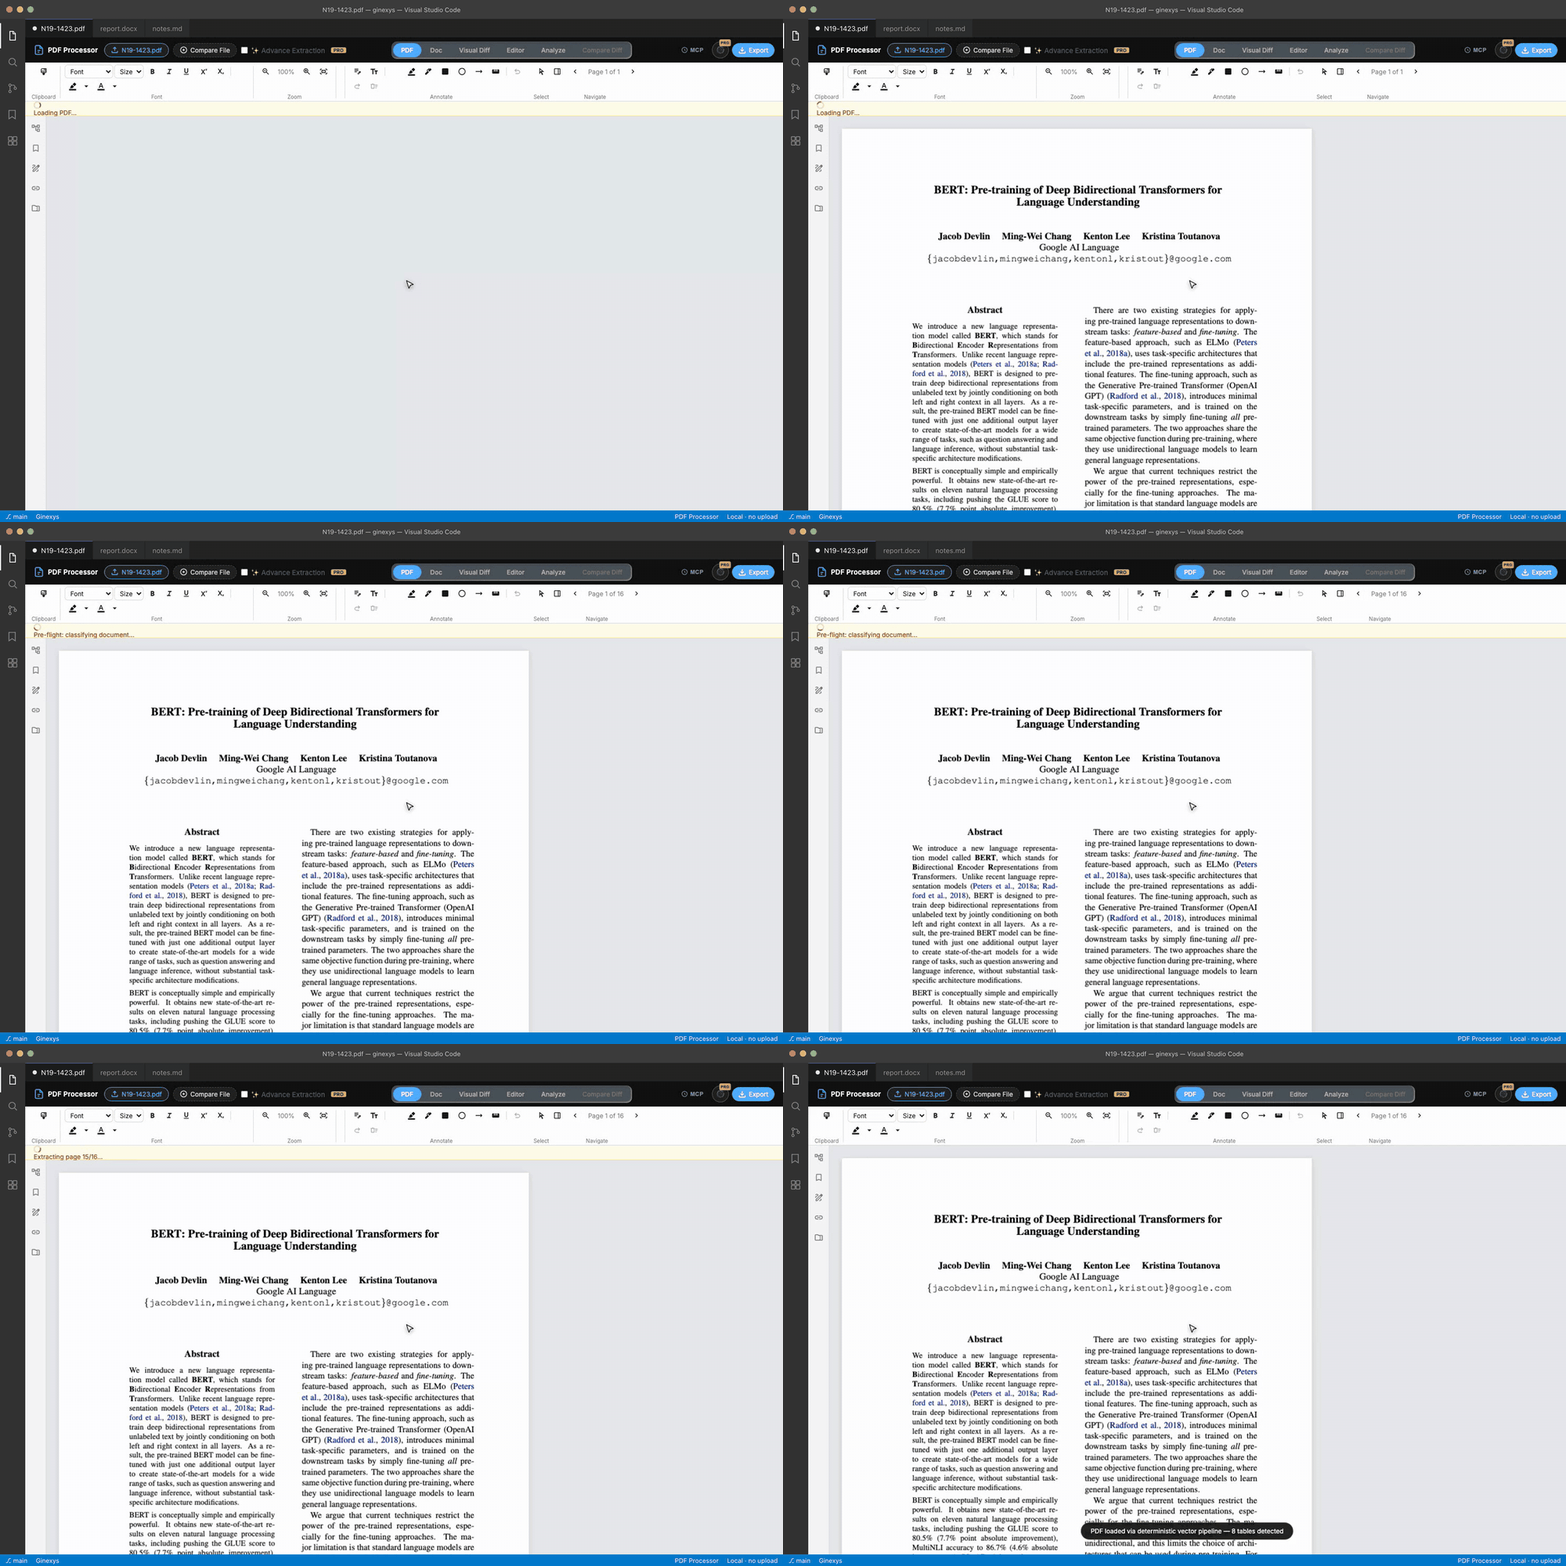
Step-by-step guide: open the Analyze tab, inspect detected column gutters, headings, and table bounding boxes, adjust spatial sensitivity sliders, and re-extract the page.
TLDR
When an extraction misidentifies a column gutter, breaks a paragraph, or misses a table boundary, switch to the Analyze tab. The geometry canvas visualizes the extractor's spatial classification model with color-coded bounding boxes. Adjust sensitivity sliders in the side panel or press single-key shortcuts to override region types, then click Re-extract to update the document.
Before you start
You need a PDF document with complex layout features (such as multi-column text, callout boxes, or borderless tables).
Everything runs locally in your browser, allowing you to tune spatial parameters and test re-extractions in milliseconds without waiting for server queues.
Step 1 — Open your PDF and switch to the Analyze tab
Click Open File to load your document, then click Analyze in the top navigation strip.
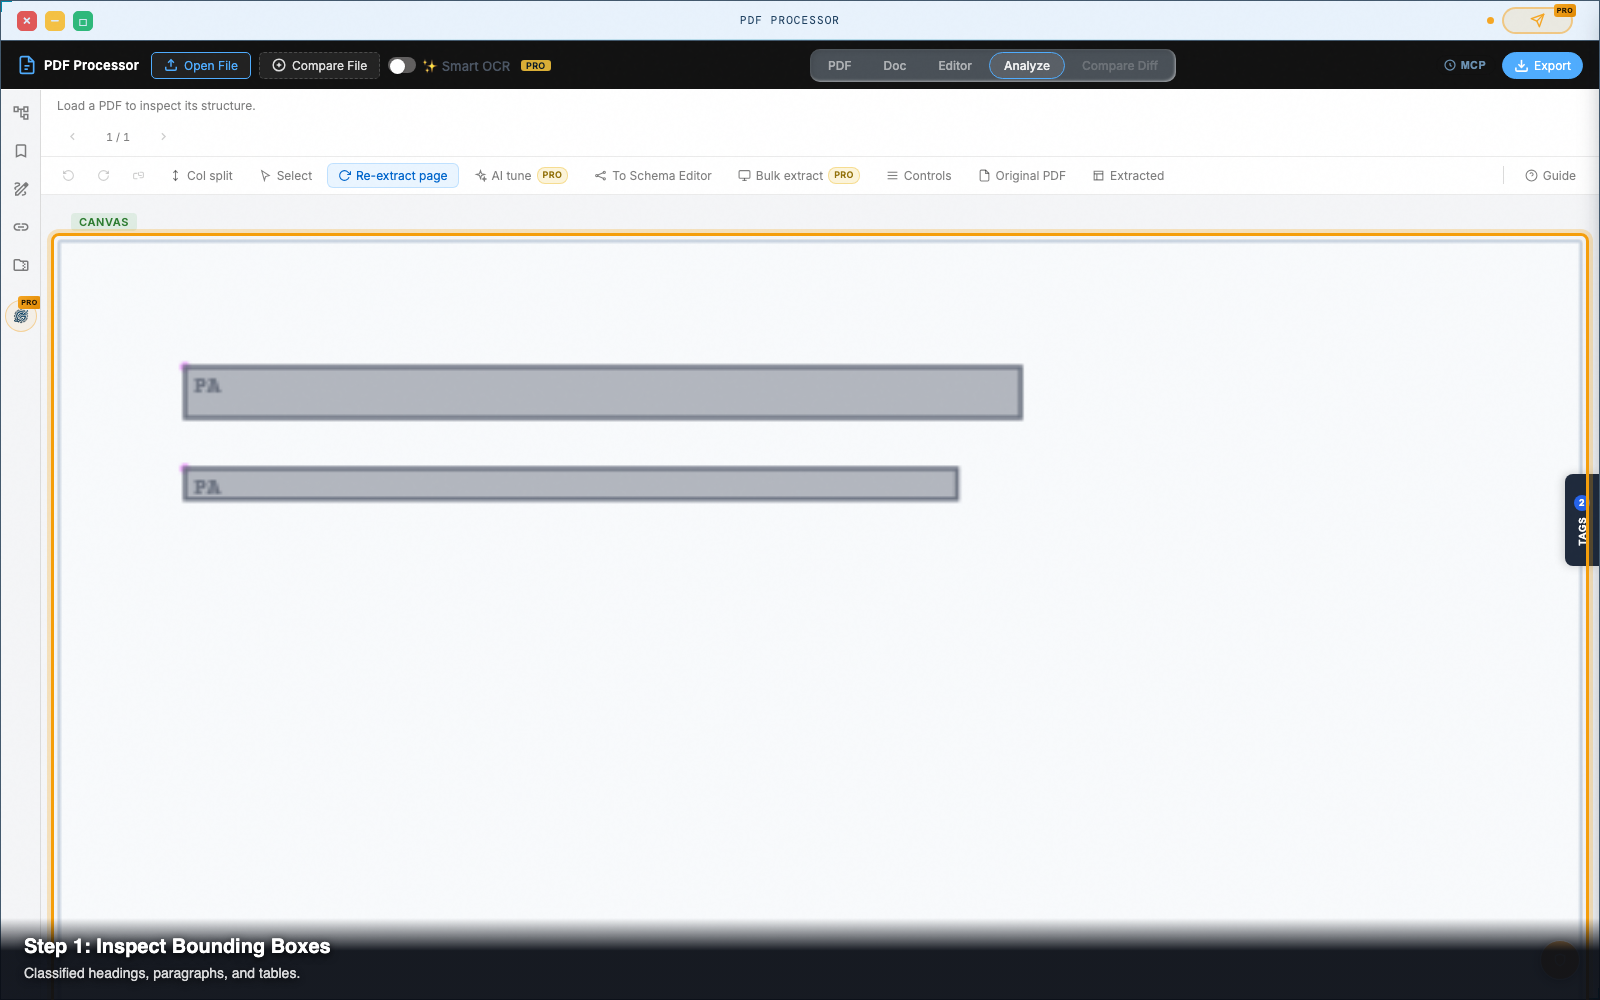
The central viewport transforms into an interactive spatial analysis canvas. This displays the underlying vector geometry, text baselines, and detected bounding boxes drawn over the page coordinates.
Step 2 — Read the color-coded bounding boxes
Inspect the labeled boxes drawn over the page:
- Blue Boxes (
H): Detected headings (<h1>through<h6>). - Gray Boxes (
P): Body paragraphs and narrative text blocks. - Orange Boxes (
L): Lattice grid tables (enclosed by ruling lines). - Green Boxes (
S): Stream tables (borderless tables separated by whitespace gutters). - Purple Boxes (
I): Embedded raster and vector images.
Step 3 — Tune extraction thresholds with side panel sliders
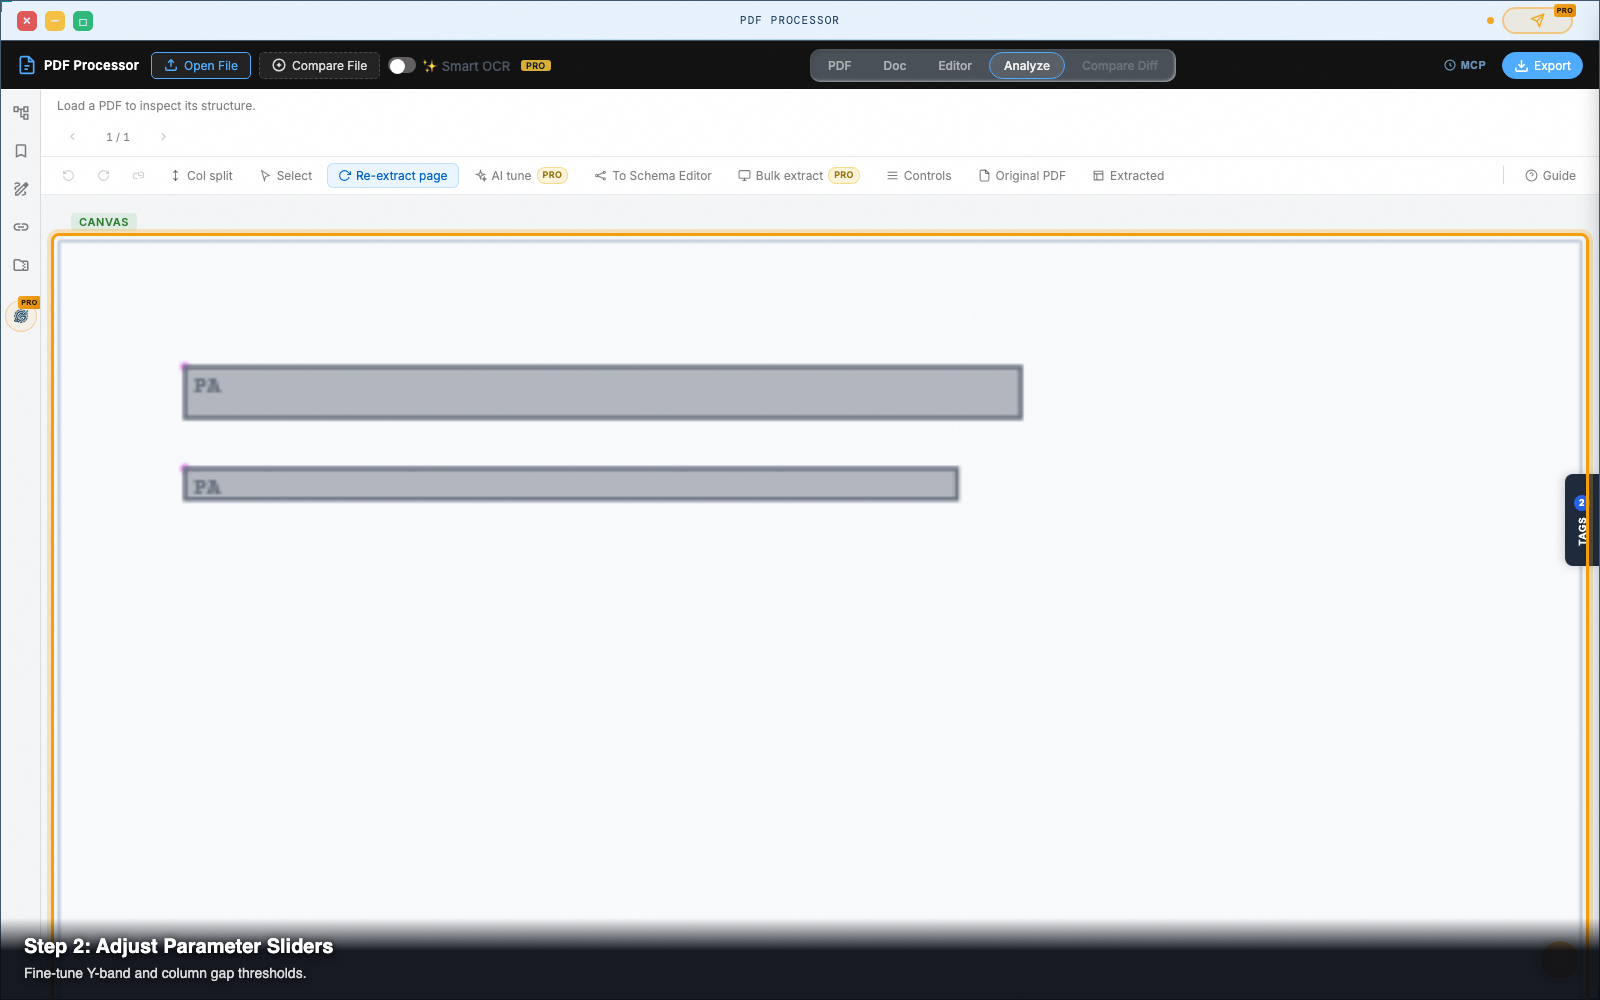
Open the parameter sliders on the right-hand Analyze Controls panel to fine-tune spatial tolerances:
- Col Gap Min: Controls the minimum gutter width required to split adjacent text into separate columns. Increase this if wide paragraph indents are incorrectly detected as columns.
- Y-Band Tol: Adjusts horizontal baseline tolerance. Increase this for documents with varying font sizes or subscripts so lines do not fragment.
- Para Gap: Defines the vertical line spacing required to split text into distinct paragraphs.
- Stream Conf: Adjusts the sensitivity threshold for detecting borderless tables. Lower values help capture low-contrast table columns.
Step 4 — Override region classifications with single-key shortcuts
Click on any bounding box on the canvas to select it (a cyan highlight ring appears).
Press any of the following keys to instantly reclassify the region:
| Key | Target Region Type | Result |
|---|---|---|
H | Heading | Formats text as a semantic header |
P | Paragraph | Treats region as standard body text |
L | Lattice Table | Extracts enclosed lines as a grid table |
S | Stream Table | Extracts whitespace columns as a table |
I | Image / Figure | Preserves region as an image asset |
Delete / Backspace | Skip Region | Excludes the selected area from extraction |
Step 5 — Add manual column split dividers
For dense academic papers or multi-column news sheets with tight gutters:
- Click Add Split in the Analyze toolbar.
- Click anywhere on the canvas between two text columns.
- A vertical cyan guideline appears across the page. Drag the split guide left or right to position it precisely down the column gutter.
Step 6 — Click Re-extract to update your output
Once your parameter adjustments and manual overrides are set, click Re-extract Page in the Analyze toolbar.
The Web Worker reprocesses the page geometry using your custom rules in under 100 milliseconds. Switch back to the Doc tab to inspect your clean, perfectly separated columns and tables.
Pro tip: the T-split comparison
In the Analyze toolbar, toggle on both Original File and Extracted.
The view transforms into a three-pane T-split layout: the original source PDF and your extracted output stack on the left, while the Analyze geometry canvas stays on the right. This lets you see the source page, the spatial algorithm, and the final HTML output side by side.
Next steps
PDF Processor — Pull text, tables, and vector geometry out of PDFs — in the browser, with no upload.