How to Extract Tables from a PDF Locally in Your Browser
Step-by-step guide: load a tabular PDF, detect lattice and borderless stream tables, edit cells in the embedded table editor, and export clean CSV, Markdown, or HTML.
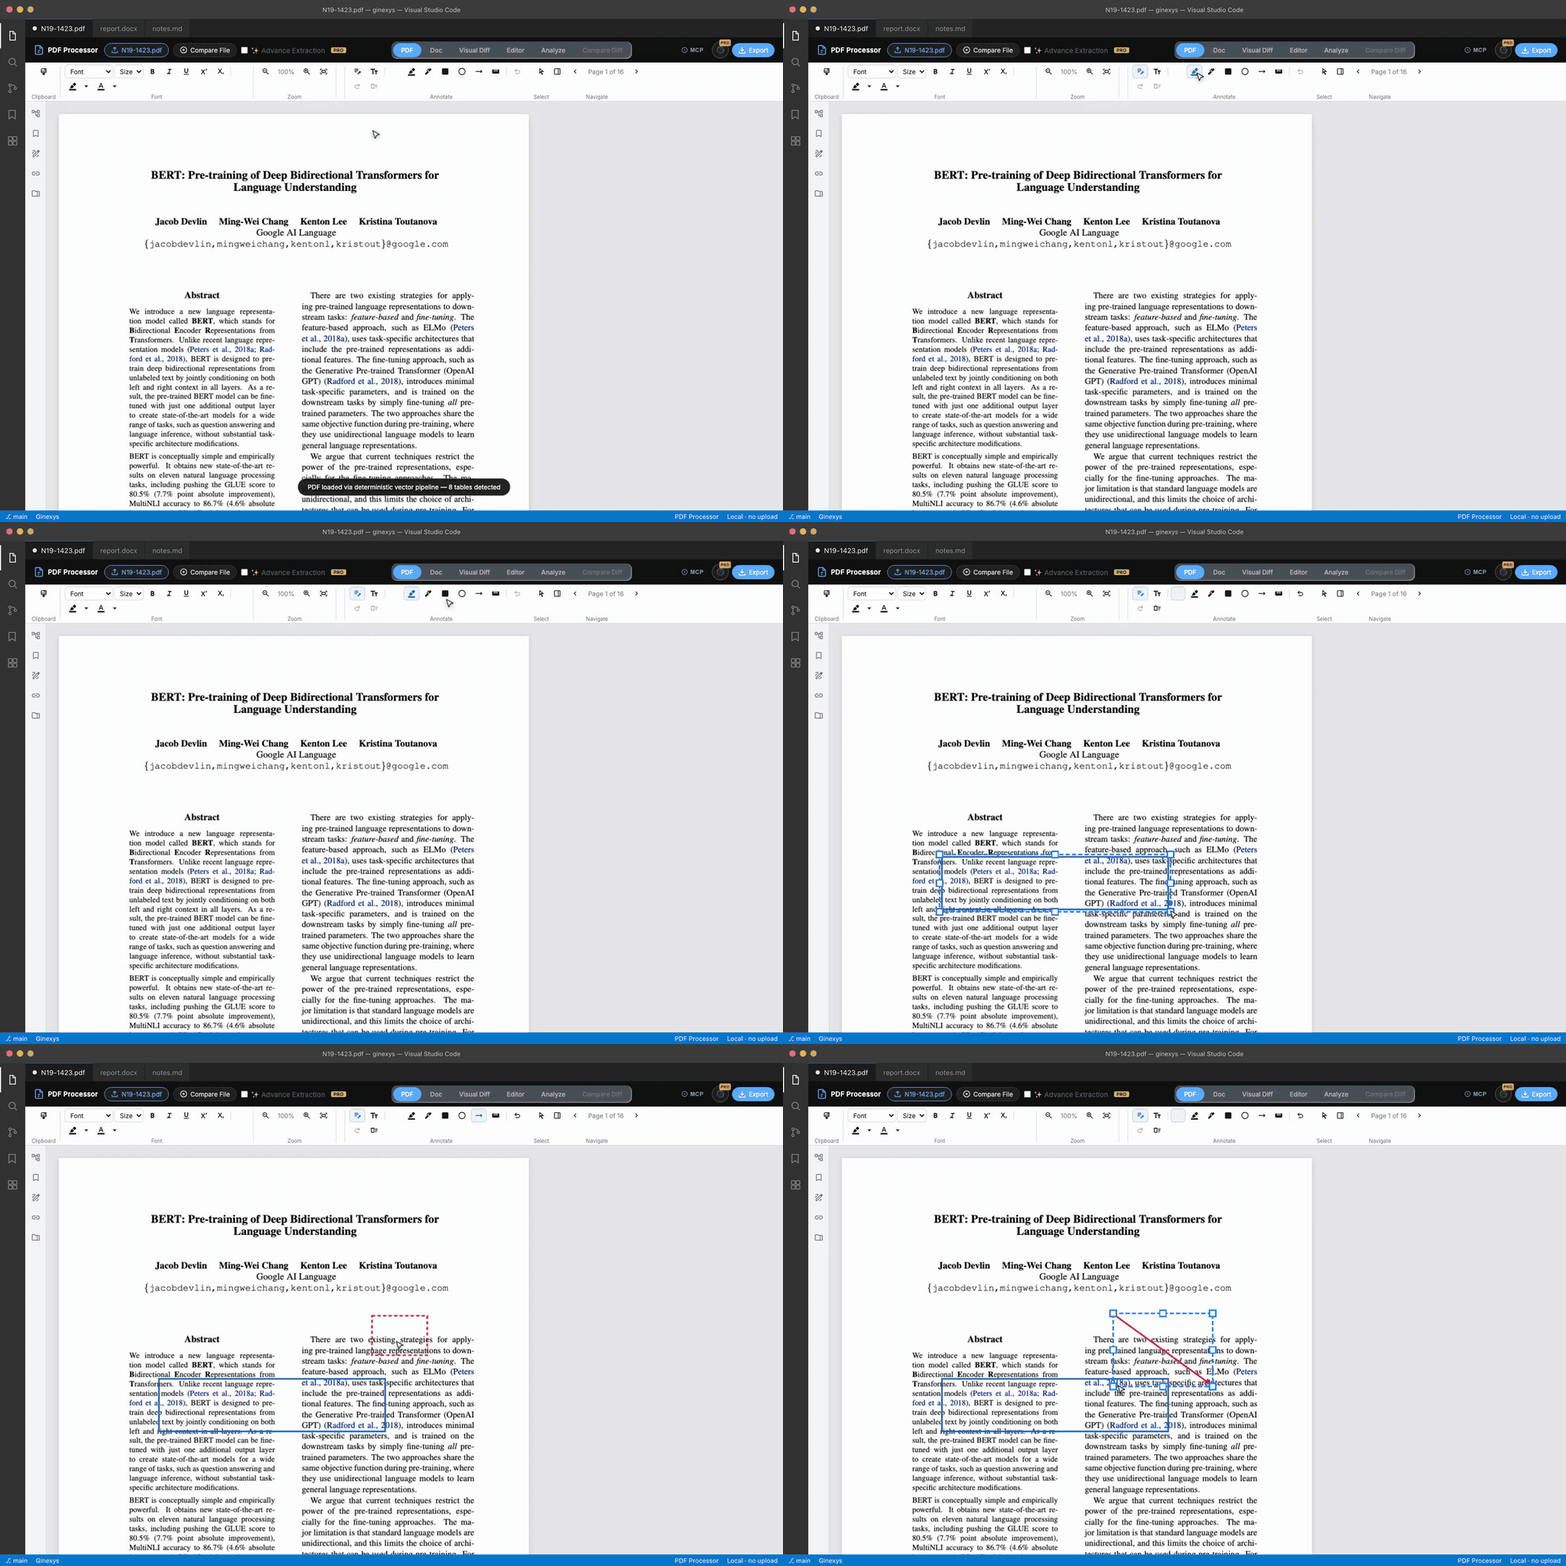
TLDR
Open any PDF containing tables, switch to the Doc tab to inspect the auto-detected table grid, and click into any cell to edit numbers or headers. For complex borderless tables, switch to the Analyze tab to adjust column detection thresholds, then click Export to save your tables as clean CSV, Markdown, or structured HTML.
Before you start
You need a PDF with tables and a web browser. PDF Processor extracts tables entirely within your browser memory using local Web Workers: your financial files, invoices, or customer logs never touch an external server.
For this guide, a document with both bordered tables (with lines) and borderless tables (separated by whitespace gutters) is ideal.
Step 1 — Load your document
Click Open File in the top bar and select your PDF document.
Extraction starts immediately. The engine scans character coordinates and vector lines to classify tabular regions without requiring cloud OCR tokens.
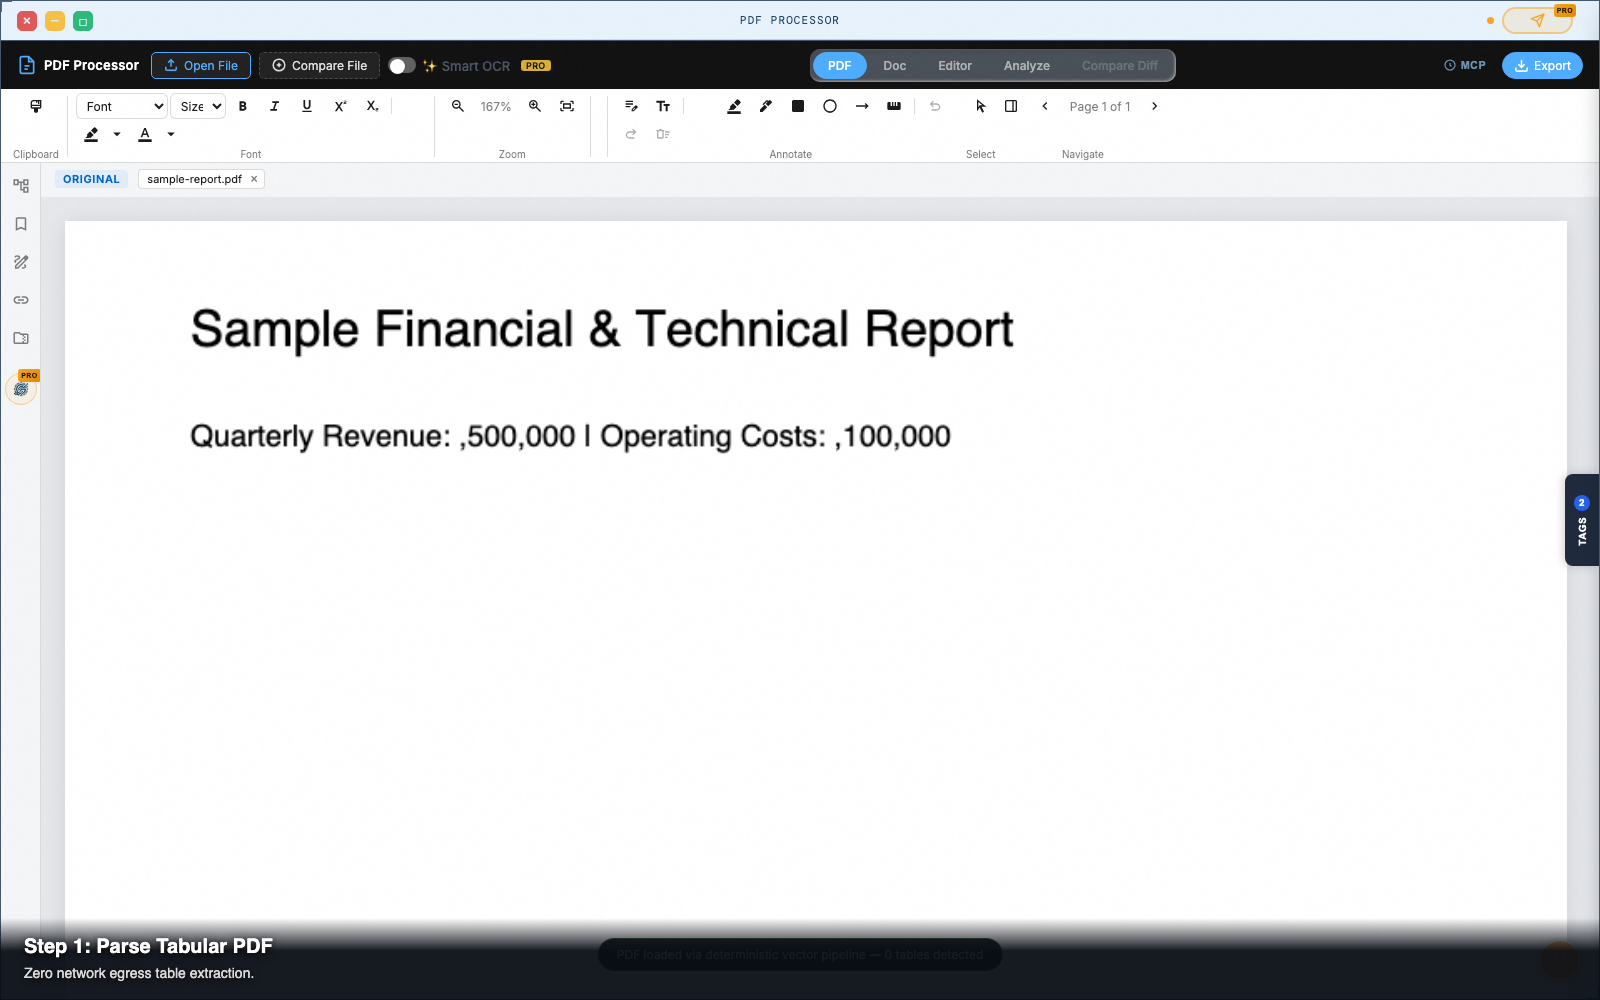
Step 2 — Review detected tables in the Doc view
Click the Doc tab in the top navigation strip.
The document view renders all detected tables as native, clean HTML <table> elements:
- Table headers automatically format with
<th>tags. - Data rows align into clean
<tr><td>cells. - Numbers and dates retain their original column positions rather than spilling into adjacent paragraphs.
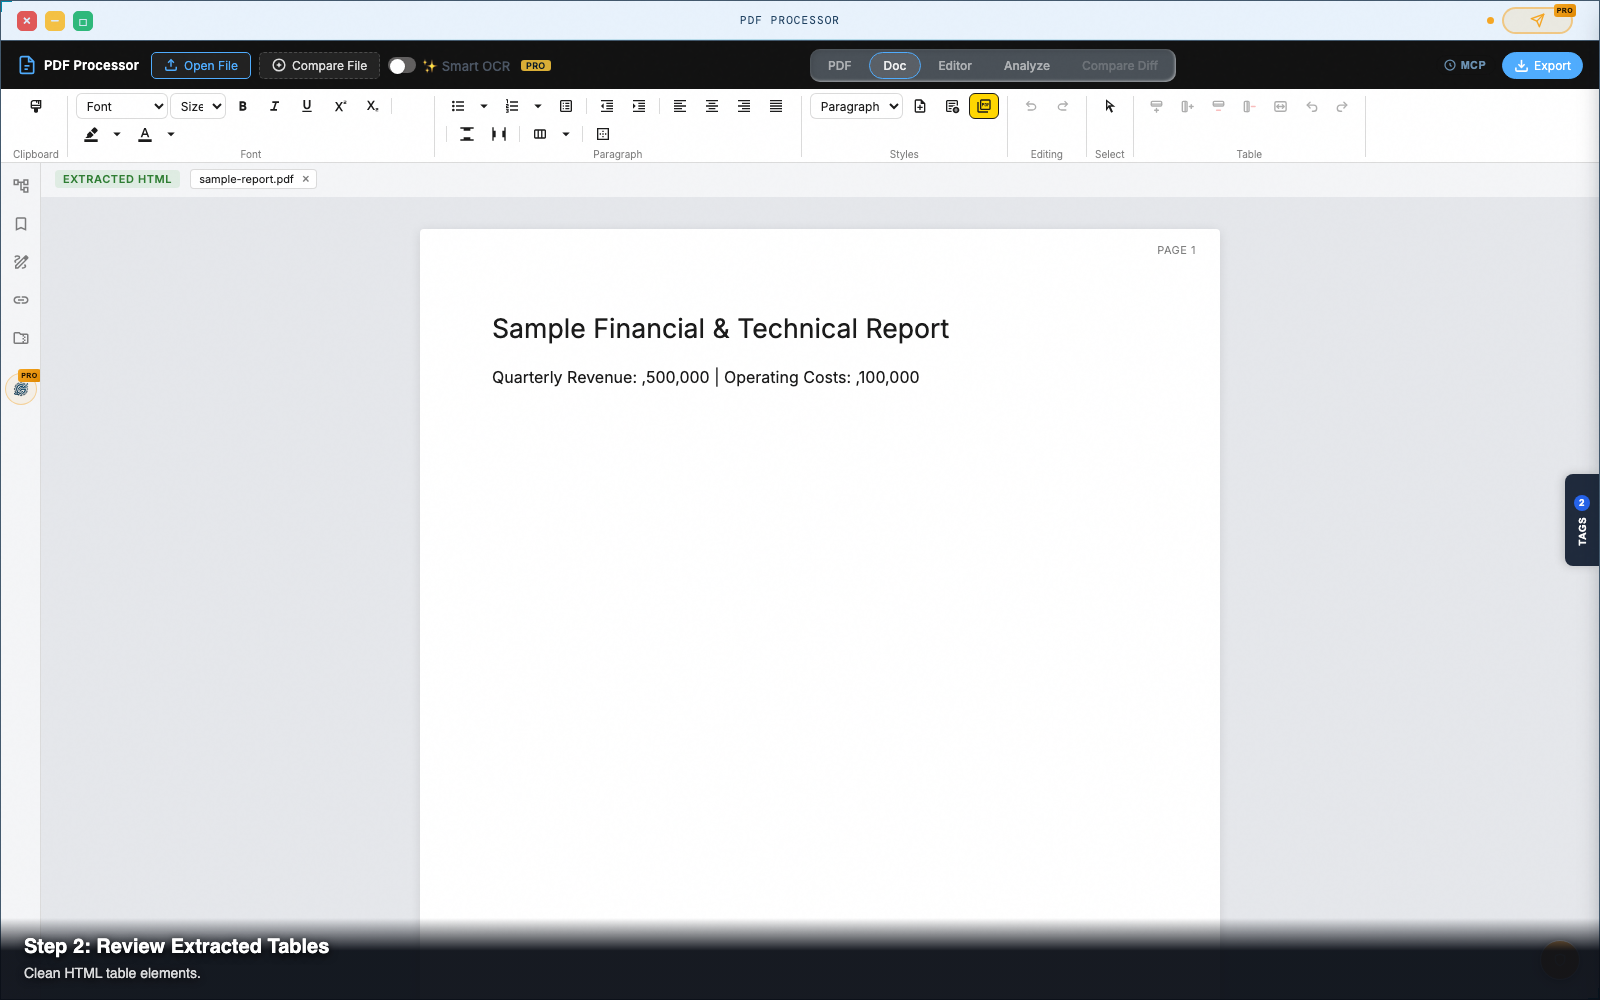
Step 3 — Edit and format table cells
Click directly into any cell inside the table to make inline corrections.
- Fix OCR or Text Typos: Type directly into cells to fix misrecognized numbers.
- Add or Remove Rows: Use table context actions to insert new rows or delete empty header rows.
- Format Numbers: Select columns to apply bold formatting or text alignments using the floating toolbar.
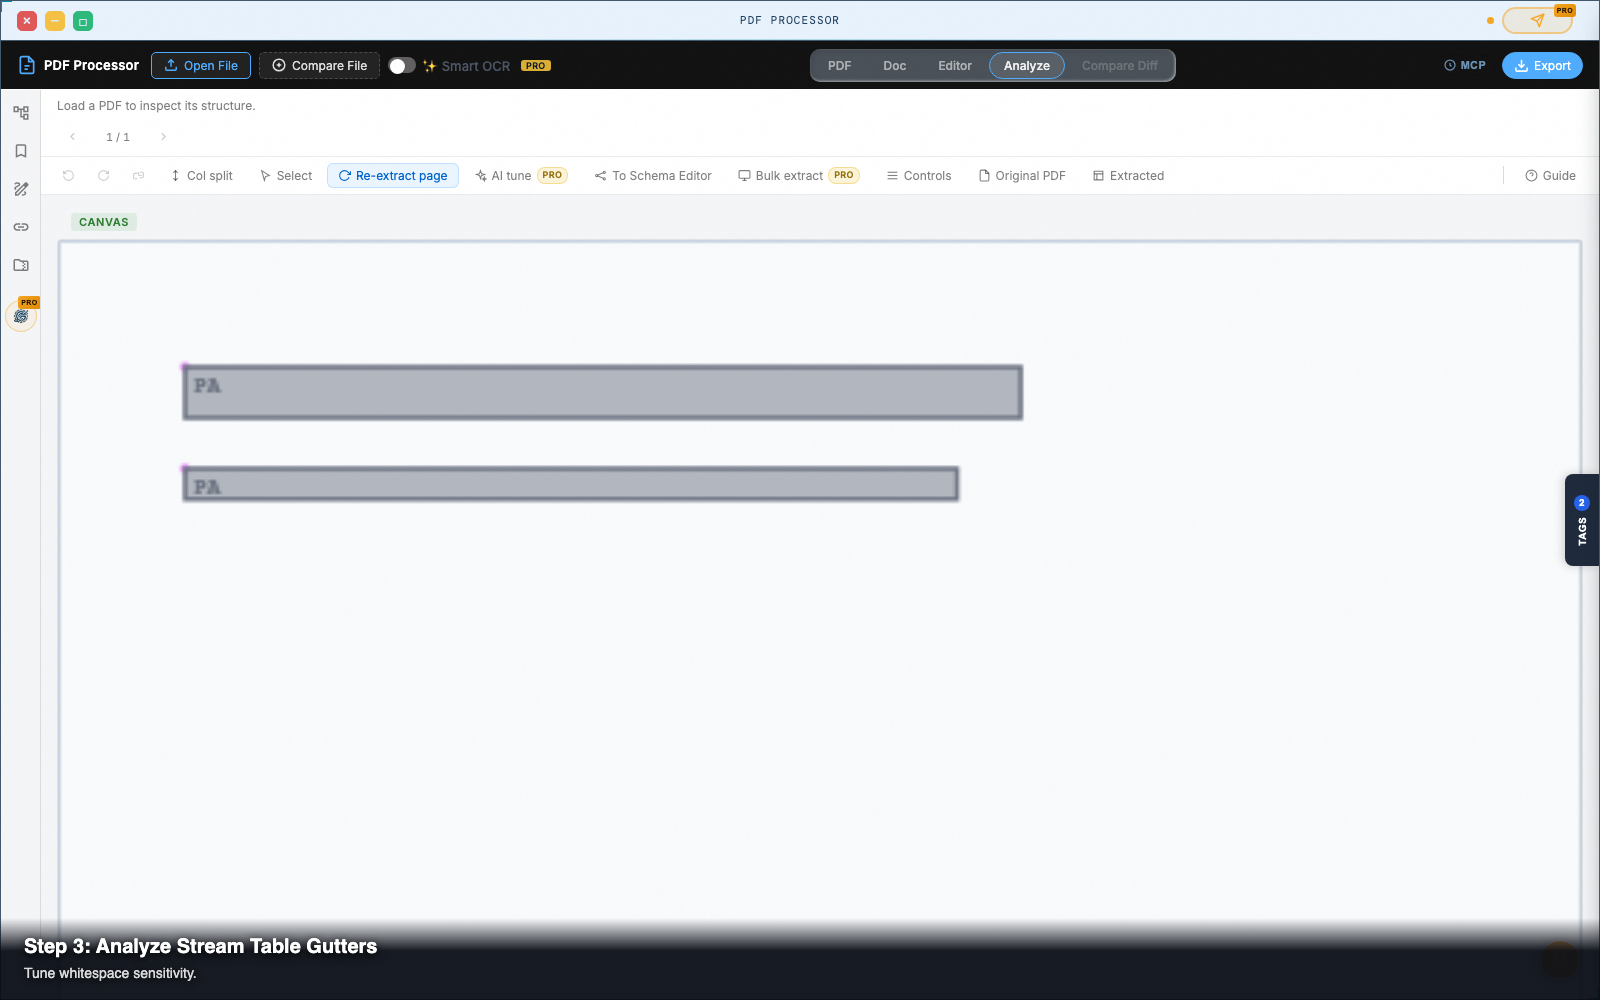
Step 4 — Inspect table structure in the Analyze tab
If a table with borderless whitespace gutters missed a column boundary, click Analyze in the top tab strip.
- The Analyze canvas highlights detected tables with colored bounding boxes (blue for lattice grid tables, green for borderless stream tables).
- Look at the right-hand inspection panel to check detected column gutters and Y-band row alignments.
- Adjust the Stream Table Sensitivity slider to tune whitespace tolerance until every column gutter is cleanly identified.
Step 5 — Export to CSV, Markdown, or HTML
Once your table structure is verified, click Export in the top-right header:
- Structured JSON (.json): Exports raw table matrices with row and column indices.
- Markdown (.md): Generates clean GitHub Flavored Markdown tables (
| Column 1 | Column 2 |). - Standalone Webpage (.html): Downloads the tables wrapped in responsive CSS.
Cmd+C / Ctrl+C to paste clean tabular data directly into Microsoft Excel or Google Sheets.
Pro tip: lattice vs stream tables
The extraction engine distinguishes between two distinct table types:
- Lattice Tables: Tables enclosed by visible horizontal and vertical ruling lines. The engine traces line intersections to build an exact cell grid.
- Stream Tables: Borderless tables where columns are separated purely by whitespace gaps. The engine uses projection histograms along the X-axis to group text baselines into columns.
Next steps
PDF Processor — Pull text, tables, and vector geometry out of PDFs — in the browser, with no upload.