How to Build a No-Code Data Pipeline to Join, VLOOKUP, and Filter CSV Files
Step-by-step tutorial: load sheets into Node Editor, wire Join, VLookup, and Filter nodes on the visual canvas, execute graphs with live Web Workers, and build output tables.
TLDR
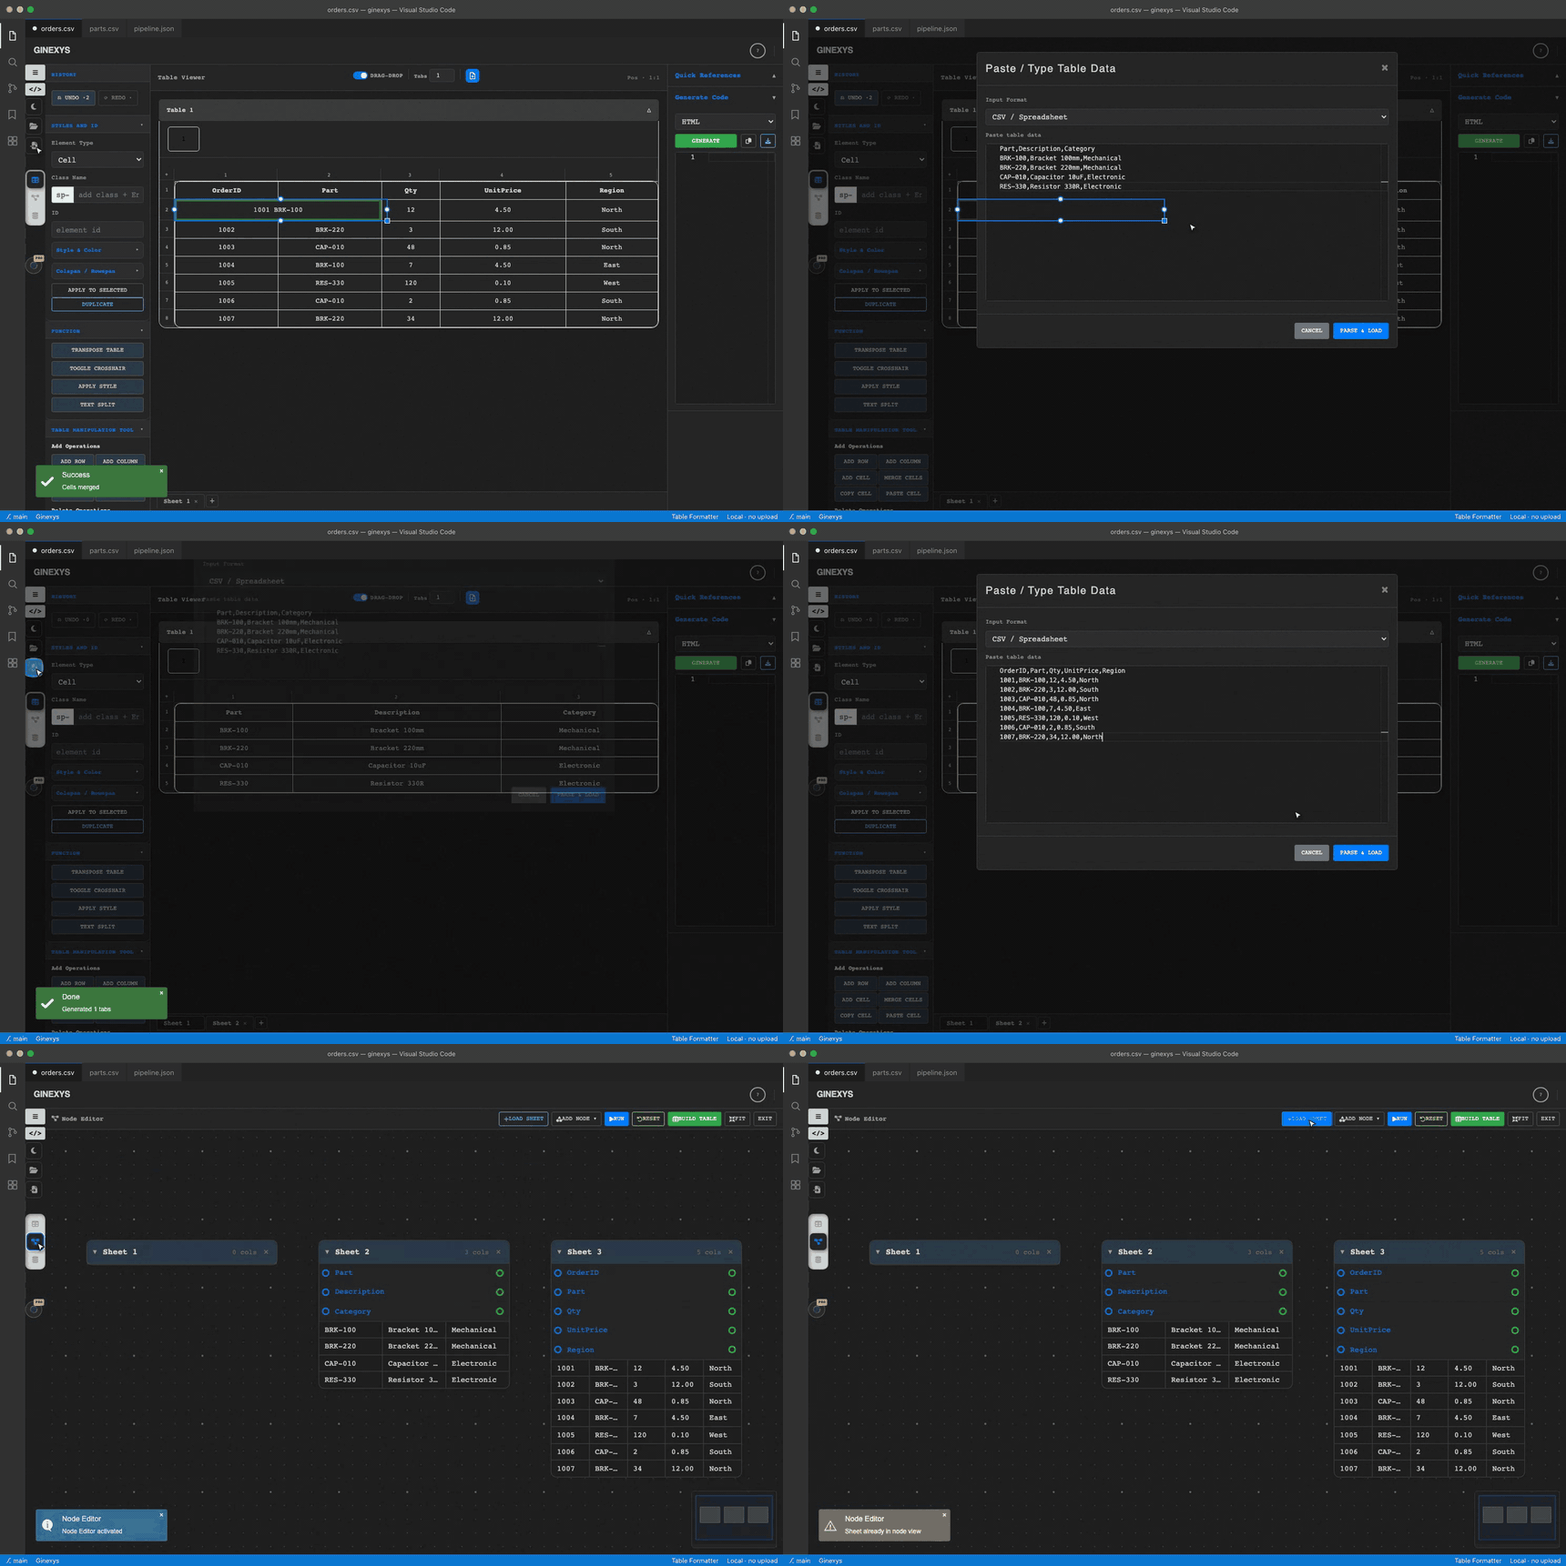
Switch Table Formatter to Node Editor via the diagram icon in the left rail, click Load Sheet to bring your spreadsheet datasets onto the canvas, and use Add Node ▾ to connect Join, VLookup, Filter, or Formula nodes. Configure parameters in the sliding config panel on the right, click Run to execute the graph in a local Web Worker, and click Build Table to output your merged dataset into a fresh sheet.
Before you start
You need two or more tabular datasets to merge or cross-reference (such as Sales_Log.csv and Employee_Directory.csv) and a web browser.
Node Editor executes pipelines in client-side Web Workers, handling thousands of rows without spreadsheet freezes or cloud server dependencies.
Step 1 — Load source datasets into Sheet Manager
In Table Formatter:
- Click the Folder Icon (
#loadFileBtn) in the left icon rail to load your first file (Sales_Transactions.csv). It opens as Sheet 1. - Click + Add Sheet in the bottom Sheet Manager tab bar (
#sheetTabBar). - Click the Folder Icon again to load your second file (
Employee_Directory.csv) into Sheet 2.
Step 2 — Switch to Node Editor Mode
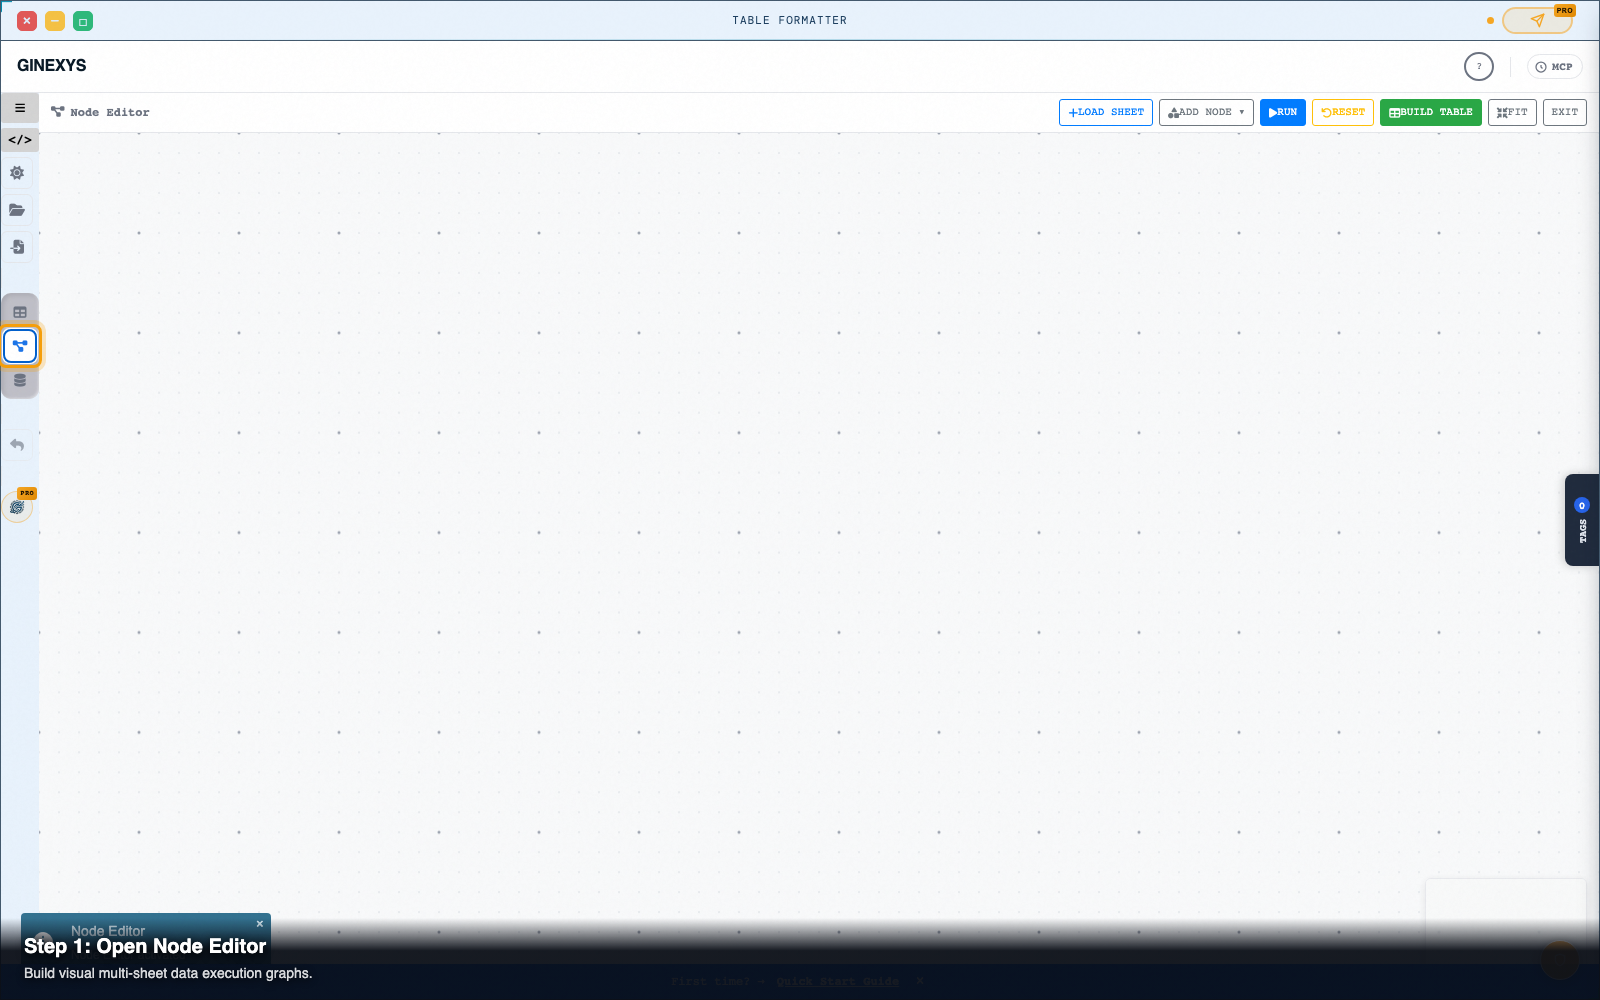
Click the Node Editor icon (#nodeEditorToggle with the project-diagram icon) in the left rail.
The center area transforms into an interactive graph canvas featuring a top action bar, a visual minimap in the bottom right (#neMinimapCanvas), and an offscreen canvas rendering pipeline.
Step 3 — Load sheets as data source nodes
In the top Node Editor header bar:
- Click Load Sheet (
#neAddFromSheet). A source node representing Sheet 1 appears on the canvas showing its detected column list and row count. - Switch active sheet in the bottom tab bar to Sheet 2 and click Load Sheet again to create the second source node.
- Drag the nodes to position them on the left side of your canvas.
Step 4 — Add and wire operator nodes (Join / VLookup)
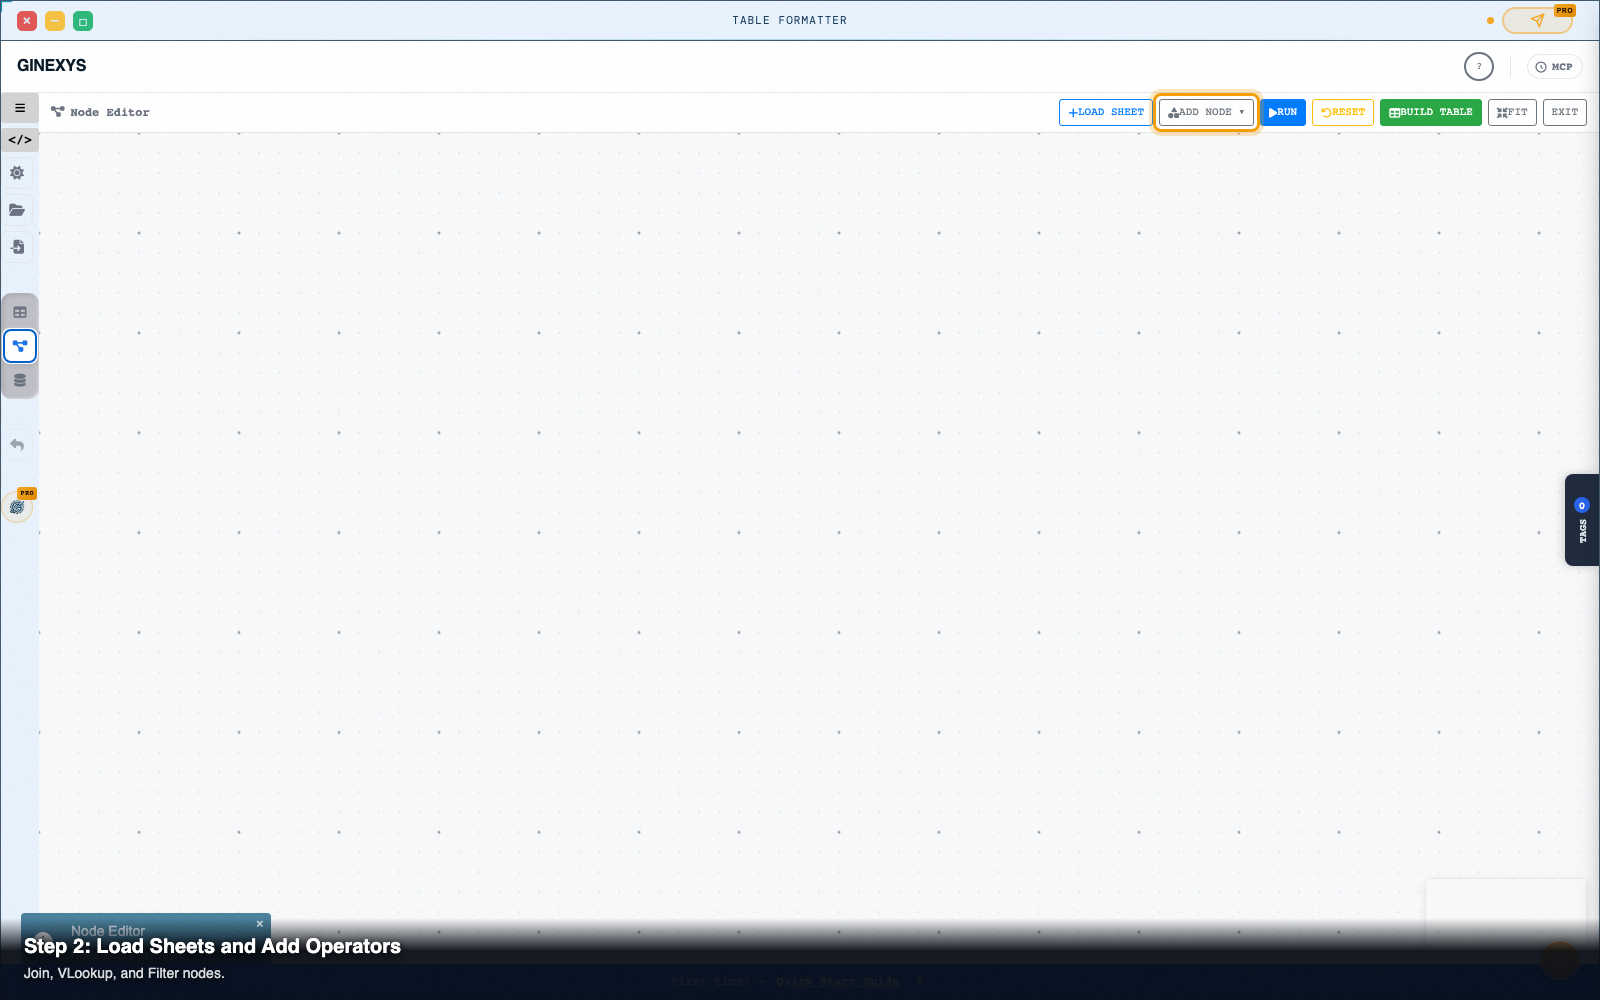
Click Add Node ▾ (#neAddNode) to open the palette flyout (#nePalette):
- Join Node: Adds a multi-table join block (supporting
Inner,Left Outer, orRight Outerjoins). - VLookup Node: Adds a key-to-value column lookup block.
- Filter Node: Adds a conditional row filter block.
- Formula Node: Adds derived column arithmetic (e.g.
Price * Quantity). - API Node: Fetches live JSON REST endpoints.
Sheet 1 and drag a connector wire to the input port of the Join Node. Drag a second wire from Sheet 2 to the second input port.
Step 5 — Configure node parameters in the Config Panel
Click on the Join Node on the canvas:
- The Node Config Panel (
#neConfigPanel) slides in from the right side. - Join Mode: Select
Inner JoinorLeft Join. - Left Key Column: Select
Rep_IDfrom Sheet 1. - Right Key Column: Select
Rep_IDfrom Sheet 2.
Column: Region, Operator: Equals, Value: West.
Step 6 — Run the graph and build the output table
- In the top action bar, click Run (
#neRunGraph). The topological engine executes nodes in sequence. Connected nodes glow green upon completion. - Select the final node (or Join Node) and click Build Table (
#neBuildTable). - A brand-new sheet containing your joined and filtered dataset is generated in the Sheet Manager.
- Click Exit (
#neExit) to switch to Table Mode and export your results as CSV, Markdown, or SQL.
Pro tip: graph minimap and fit view
Working with large pipelines containing six or more nodes?
Click Fit (#neFitView) in the header to zoom and center all nodes into view. You can also click and drag inside the interactive minimap in the bottom-right corner to pan across large execution graphs.
Next steps
Table Formatter — Clean, reshape, and convert tabular data between HTML, CSV, TSV, SQL, and Markdown.